Tag: data visualizations
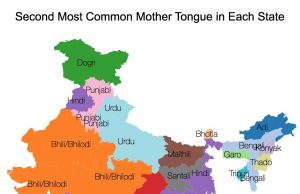
Second most common language in each state
Here is a map of the second most common language in each state of India.
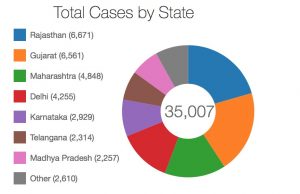
The NewsPie 2015 Swine Flu Dashboard
Keep up-to-date with the latest swine flu figures for all of India using NewsPie's interactive dashboard.
State Roads of India in 4 Charts
Compare the differences in roads and road expenditure between Indian states through our animated charts.
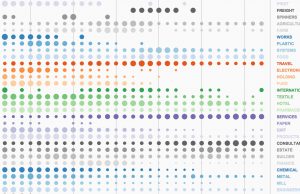
What’s in a name? Indian business activity, that’s what
Find out what company names tell us about how Indian business has been evolving over the past 35 years.
School Enrollment in India by States and Grades in 444 Charts
According to a government survey, there were 120,166,800 boys and 108,828,694 girls enrolled in Indian schools, or 11 boys for every 10 girls, which is about the same number as in the population. Looking deeper, there are wide disparities in the proportions of the male and female populations that are enrolled in school. Explore the data with a completely interactive chart that has 444 combinations!
Where does India’s Electricity come from?
According to government figures, India can generate up to 228,721 MWs of electricity, what is known as installed capacity. The actual production may be...
Which Indian states are the most entrepreneurial – Chart 2
Some states may have a high number of registered companies due to their populations. Therefore in the chart below the number of companies registered...
Which Indian states are the most entrepreneurial – Chart 1
Maharasthra, Delhi and West Bengal account for over half the total number of active registered companies in India. The number of active companies in...


